Instructor: Robert Gerard Pietrusko. Teaching Assistant: Daniel Ibañez
Spring 2014 & 2015
Geographic Representation & Speculation I: 2014
Maps do not represent reality, they create it. As a fundamental part of the design process, the act of mapping results in highly authored views of a site. By choosing what features, forces, and flows to highlight—and implicitly, which to exclude—the designer first creates the reality into which their intervention will be situated and discussed. Furthermore, the usage and materiality of space is increasingly measured, categorized, and circulated by all manners of institutions; these competing data representations often become the primary way of understanding and responding to a site. Designers are in the difficult position of approaching these geographic datasets critically while simultaneously employing them in their work. It is not enough to represent complicated networks of site forces and interactions as a neutral backdrop to one’s design; we are tasked with actively shaping them.
It is within the framework of a highly-authored design process that this course presents the fundamentals of geographic analysis and visualization.
Students: Andy Wisniewski, Natasha Harper, Andreas Viglakis, Adam Tanaka
Geographic Representation & Specualtion II: 2015
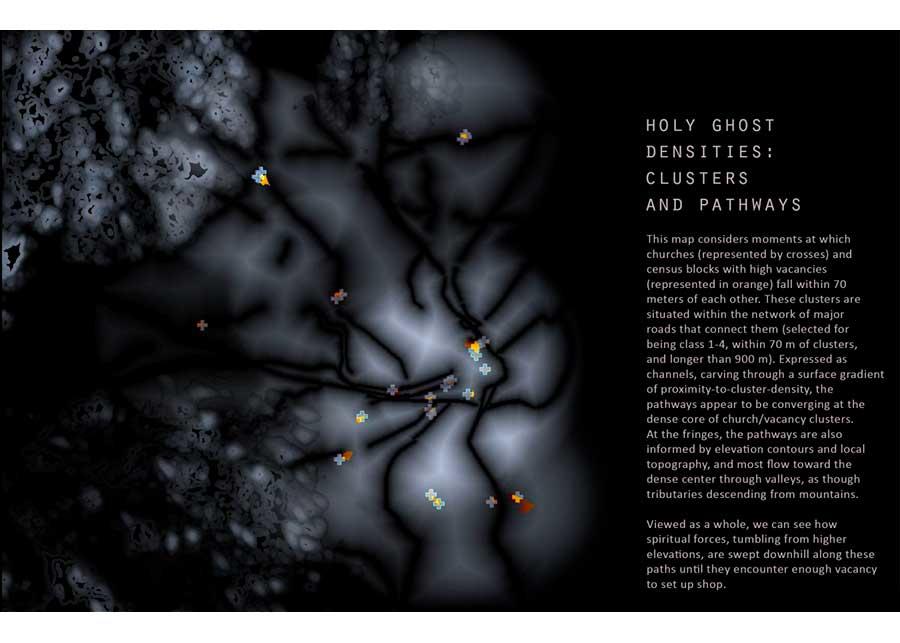
Over the course of a semester, the students worked extensively with techniques of geospatial analysis in GIS. Using ESRI’s ArcMap software, they explored data sources, data models, topological overlays, map algebra, spatial statistics, terrain analysis, and suitability modeling, among others. The students learned how to embed these techniques within larger design workflows.They addressed the visualization of spatial analysis in its various forms using Illustrator, Photoshop, and physical modeling. They have also treated mapping as an active part of the design process – where the speculative use of spatial data provides the context for 2D and 3D design proposals in Rhino. These designs will then feed back into the GIS environment as additional layers for analysis and modeling.
The last portion of the semester was devoted to visualizing geospatial data using the Processing language. The basics of coding with Processing was taught with a specific focus on representing analysis produced by students in the GIS environment


